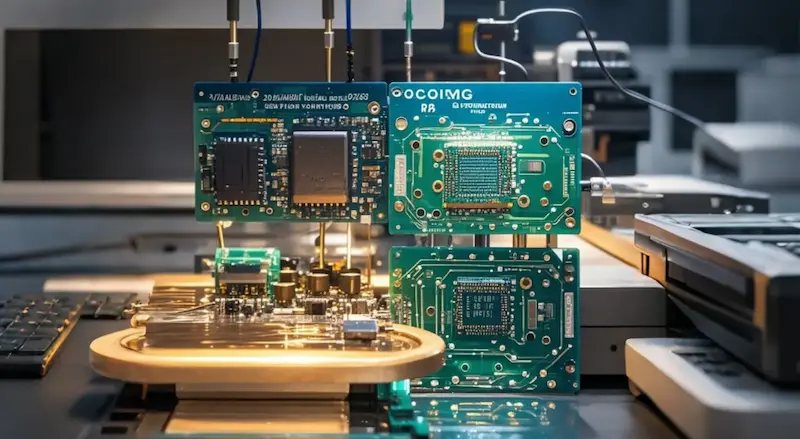
For medical device OEMs, the pressure to balance escalating clinical requirements with the demand for lower unit costs has never been higher. As we navigate the complexities of glucose monitor production, the bridge between design intent and fiscal efficiency lies in robust Design for Manufacturing (DFM) strategies. This article explores how manufacturers can leverage smart material optimization and automated assembly to secure a competitive edge without sacrificing a micron of precision.
The Fiscal Challenge in Modern Medical Electronics
The medical electronics landscape is currently defined by a delicate balancing act: maintaining the rigorous quality standards required for Class II/III medical devices while simultaneously mitigating the upward trajectory of manufacturing costs. For glucose monitor OEMs, the Printed Circuit Board Assembly (PCBA) represents the single most significant cost driver. As market saturation increases and reimbursement pressures mount, companies can no longer rely on traditional procurement models to protect their margins.
Market Dynamics Influencing Fiscal Strategy
Glucose monitoring manufacturers are navigating a triad of fiscal challenges that complicate PCBA economics. Persistent component volatility, particularly for microcontrollers and specialized sensors, has forced manufacturers to carry excessive safety stock, tying up critical working capital. Furthermore, the rapid transition toward continuous glucose monitoring (CGM) requires advanced miniaturization and wireless connectivity, which inherently increases R&D overhead and component density on the PCB.
| Challenge | Economic Impact | Operational Risk |
|---|---|---|
| Component Shortages | Increased unit cost via spot-market sourcing | Production line downtime |
| Advanced R&D | Higher NPI and qualification expenses | Extended time-to-market |
| Miniaturization | Increased assembly/complexity fees | Yield degradation |
Strategic Fiscal Considerations
- How do component shortages impact long-term ROI?
Beyond immediate price spikes, shortages cause significant resource drain through frequent redesigns to accommodate alternative components, delaying revenue realization. - Is miniaturization inherently more expensive?
While component footprint reduction increases PCB layer counts and assembly complexity, it can offer long-term ROI by reducing total material usage and device form-factor overhead if handled through early design-for-manufacturing (DFM) engagement. - Why are R&D costs rising for glucose monitors?
The shift from traditional blood glucose meters to connected, data-rich CGM systems requires integrating low-power Bluetooth, high-precision analog front ends, and sophisticated firmware, all of which elevate the Bill of Materials (BOM) complexity.
Addressing these challenges requires a shift from passive cost-tracking to active cost-engineering. By integrating DFM methodologies at the earliest stages of the product lifecycle and aligning procurement strategies with robust supply chain visibility, OEMs can safeguard their profitability without sacrificing the precision and reliability essential to patient care.
Strategic DFM: Designing for Cost and Scalability
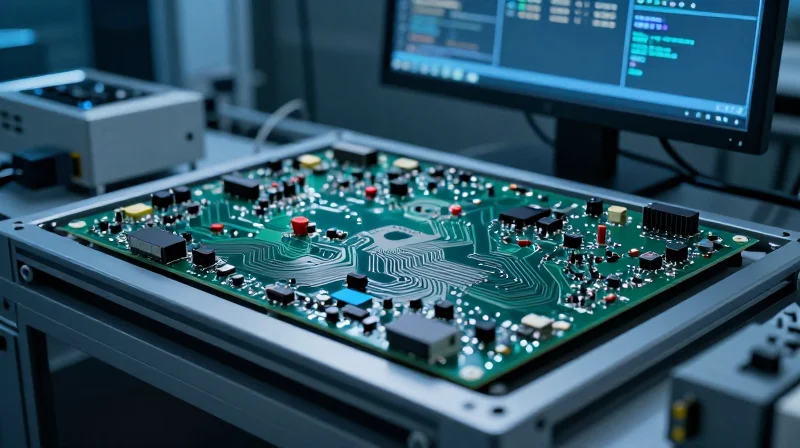
The Economic Imperative of Early DFM Integration
In the highly regulated glucose monitor market, cost optimization cannot happen at the assembly line; it must happen on the CAD screen. By aligning design constraints with fabrication capabilities from the conceptual phase, manufacturers can avoid 'design debt'—a phenomenon where complex, non-standard layouts force premium pricing and extended lead times. Strategic DFM transforms the PCBA from a mere collection of components into an optimized framework that minimizes scrap rates, facilitates automated testing, and ensures seamless transition from prototype to mass production.
DFM Strategy Comparison: Traditional vs. Strategic Approach
| Feature | Traditional Design | Strategic DFM |
|---|---|---|
| Component Selection | Function-first, availability ignored | Lifecycle-mapped, multi-source validated |
| Prototyping | Low-volume focus only | Scalable design rules applied day one |
| Testing | Functional testing at end-of-line | In-circuit test (ICT) and JTAG integration |
| Post-design Cost | High risk of re-spin | Optimized for first-pass yield |
Key DFM Principles for Scalable PCBA Manufacturing
- Standardized Panelization
Utilizing standard PCB panel sizes reduces material waste and allows for higher throughput in pick-and-place machinery, directly lowering unit costs. - Component Orientation and Density
Optimizing component placement for simultaneous reflow soldering minimizes thermal stress and prevents shadowing, which ensures higher reliability in life-critical medical applications. - Supply Chain Resilience
Designing with 'footprint-compatible' alternatives allows engineers to switch between manufacturers during component shortages without requiring a new board layout.
Frequently Asked Questions: DFM and ROI
- How does DFM affect the time-to-market for medical devices?
While it requires more initial effort, DFM significantly reduces time-to-market by preventing the multiple design iterations (re-spins) often triggered by manufacturing failures. - Can DFM be applied to existing legacy designs?
Yes, through 'Design for Cost' audits where engineers analyze current bill-of-materials and assembly processes to identify high-cost bottlenecks for potential value-engineering updates.
Material Optimization Techniques
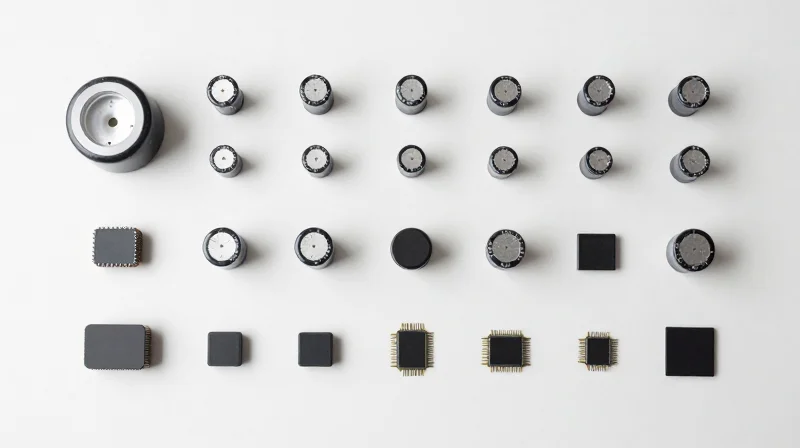
Strategic Component Selection for Medical Reliability
The primary driver of PCBA cost in glucose monitoring is the Bill of Materials (BOM). Manufacturers often over-specify components, opting for military-grade or industrial-rated parts where standard, high-reliability commercial components would suffice. By shifting to a 'fit-for-purpose' procurement strategy, companies can reduce raw material costs by 15–20% without violating strict medical device performance standards.
Comparative Cost Analysis of Component Tiers
| Component Category | Performance Level | Cost Impact | Recommended Use |
|---|---|---|---|
| Standard Commercial | High reliability for consumer electronics | Low | General interfaces and non-critical modules |
| AEC-Q Qualified | Automotive grade, high vibration resistance | Medium | Primary sensing circuits |
| Medical/Mission-Critical | Certified for life-sustaining use | High | Glucose sensing and logic processing |
Key Optimization Strategies
- Consolidation of BOM
Utilize a common set of components across different product tiers. Reducing the number of unique SKUs decreases inventory management overhead and increases volume-based purchasing power. - Lifecycle Management
Avoid components nearing their 'End-of-Life' (EOL) to prevent costly redesigns mid-production cycle. Partner with suppliers to track product roadmaps. - Form Factor Minimization
Select smaller package sizes (e.g., 0201 or 01005 passives) only where essential. Using larger, standardized package sizes simplifies assembly and reduces pick-and-place errors.
Frequently Asked Questions
- Does lower-cost component selection risk regulatory compliance?
Not if the substitution is validated. Cost reduction focuses on component grade optimization rather than omitting protection circuitry. All changes must go through formal Verification and Validation (V&V) procedures. - How can I mitigate supply chain risks when optimizing costs?
Maintain a 'Design for Availability' approach by qualifying multiple vendors for every critical BOM line item to ensure stability during market shortages.
Leveraging Automation for High-Volume PCBA

Transitioning from manual assembly to automated Surface Mount Technology (SMT) lines is the most effective strategy for scaling glucose monitor production. High-volume manufacturing demands repeatability that manual labor cannot sustain; automated systems reduce human error to near-zero, significantly increasing first-pass yield (FPY) and lowering the cost per unit through rapid throughput.
Comparative Efficiency: Manual vs. Automated Assembly
| Metric | Manual Assembly | Automated SMT |
|---|---|---|
| Throughput | Low (Unit-by-unit) | Very High (Component-per-second) |
| Precision | Variable/Human error prone | Micron-level repeatability |
| Cost per unit | High (Labor intensive) | Low (Scalable/Fixed cost) |
| Yield Rates | 85% - 92% | 99.5%+ |
Key Drivers of ROI in Automated PCBA
- Reduction in Labor Costs
Automated lines require fewer operators, shifting overhead from variable labor expenses to predictable, long-term capital equipment depreciation. - Optimized Solder Paste Application
High-speed automated stencil printers ensure exact volume control, minimizing solder waste and eliminating common bridge or open-circuit defects. - In-Line Automated Optical Inspection (AOI)
Integrating AOI directly into the SMT line allows for real-time defect detection before components proceed to final testing, drastically reducing the cost of rework.
Frequently Asked Questions Regarding Automation
- Is automation viable for mid-volume production runs?
Yes, modular SMT lines can be reconfigured quickly for different product versions, ensuring that capital investment provides value even when scaling or pivoting product designs. - Does automation compromise the quality of medical-grade sensors?
On the contrary, medical device standards like ISO 13485 benefit from the documentation and consistency provided by automated lines, which maintain rigorous control over every variable in the assembly process.
Maintaining Clinical Precision Amid Cost Cuts

Integrating Verification into Lean Workflows
As manufacturers shift toward leaner, high-speed assembly to manage rising PCBA costs, the risk of diagnostic drift must be mitigated through automated verification. Rather than treating quality control as a terminal end-of-line process, successful manufacturers embed AOI (Automated Optical Inspection) and ICT (In-Circuit Testing) directly within the robotic SMT sequence. This approach detects solder defects, component misplacements, or impedance deviations before they cascade into the final assembly stage, effectively eliminating the costs associated with scrap and rework.
Strategic Quality Assurance Methodologies
| Methodology | Cost Impact | Precision Benefit |
|---|---|---|
| AOI Integration | Low (High initial CAPEX) | Real-time defect detection |
| Flying Probe Testing | Medium | High reliability for prototyping |
| Functional System Test | High | Ensures clinical accuracy |
Regulatory Compliance and Data Integrity
Regulatory bodies, including the FDA and EMA, mandate strict traceability for medical device components. To maintain precision while cutting costs, digital twin technology and cloud-based MES (Manufacturing Execution Systems) allow manufacturers to capture high-fidelity performance data for every board. This automated audit trail ensures that even if component specifications are optimized for cost, the device maintains consistent adherence to ISO 13485 standards.
Frequently Asked Questions on Quality Maintenance
- How does automated testing reduce long-term quality costs?
Automated testing captures failures at the earliest possible stage, preventing costly late-stage failures and reducing the overall liability associated with field device inaccuracies. - Can I switch to lower-cost components without degrading diagnostic accuracy?
Yes, provided the alternative components undergo rigorous tolerance analysis and hardware-in-the-loop (HIL) testing to ensure the glucose sensor signal chain remains unaffected. - What is the role of digital traceability in cost-reduction?
Digital traceability minimizes human error in the quality control chain and provides the necessary documentation to satisfy regulatory scrutiny without requiring labor-intensive manual record-keeping.
Accelerating Time-to-Market Through Streamlined Processes
Optimizing Workflows for Rapid PCBA Deployment
Accelerating time-to-market in medical device manufacturing requires a shift from linear, siloed production steps to an integrated, concurrent engineering approach. By synchronizing PCB design with high-speed automated assembly protocols, manufacturers can identify and resolve potential production bottlenecks before they occur, effectively shrinking the product development lifecycle while ensuring robust quality standards.
Process Efficiency Comparison
| Process Method | Lead Time Impact | Error Potential | Scalability |
|---|---|---|---|
| Manual Assembly | High (4-6 weeks) | High | Low |
| Semi-Automated | Moderate (2-3 weeks) | Moderate | Medium |
| Fully Integrated SMT | Low (<1 week) | Minimal | High |
Frequently Asked Questions
- How does early DFM implementation accelerate launch timelines?
Design for Manufacturing (DFM) identifies board-level complexities early, reducing the need for redesign cycles and accelerating transition from prototype to mass production. - Can automation reduce testing time without sacrificing clinical precision?
Yes, automated optical inspection (AOI) and in-circuit testing (ICT) provide real-time validation, replacing time-consuming manual inspection while maintaining the high reliability required for glucose monitoring devices. - Does reducing assembly steps impact long-term reliability?
On the contrary, minimizing touchpoints during assembly reduces the potential for human error and electrostatic discharge (ESD) damage, often resulting in a more consistent and reliable final PCBA.
Case Study: Achieving 20% Reduction in Unit Cost

Project Overview: Optimizing the Next-Gen CGM
Faced with aggressive market competition and rising component costs, a manufacturer of next-generation continuous glucose monitors (CGMs) sought to reduce production costs while maintaining strict medical-grade reliability. By implementing a comprehensive redesign of the PCBA architecture and shifting to high-efficiency automated assembly, the team successfully reduced unit costs by 20% within an 18-month production cycle.
Strategic Cost Reduction Pillars
| Strategy | Initial State | Optimized State | Cost Impact |
|---|---|---|---|
| BOM Management | High-cost legacy components | Consolidated multi-function ICs | 8% reduction |
| PCBA Layout | 4-layer complex design | 2-layer optimized stackup | 5% reduction |
| Assembly Process | Manual touch-up required | Full robotic SMT automation | 7% reduction |
Key Lessons and Implementation Insights
- How did component consolidation impact performance?
By replacing discrete sensors with integrated multi-function ICs, the board footprint was reduced, requiring fewer auxiliary components and simplifying the thermal management profile without degrading diagnostic accuracy. - Was regulatory compliance difficult during the transition?
No, because the design team utilized automated verification protocols that ensured the new board layout met the same electrical impedance and signal integrity standards as the original, facilitating a seamless FDA/CE re-certification process. - What was the most significant driver of the 20% savings?
The combination of design-for-manufacturing (DFM) adjustments and the elimination of manual rework through high-precision robotic assembly provided the most consistent yield improvements, directly slashing labor overhead.
The success of this project proves that cost-reduction strategies in the med-tech space are not about cutting corners, but rather about streamlining architecture and leveraging advanced manufacturing automation to eliminate waste at the source.
Choosing the Right Manufacturing Partner
Choosing the right manufacturing partner for PCBA assembly is the most critical decision in optimizing the ROI of medical devices like glucose monitors. The partner you select must act as a strategic extension of your engineering team, capable of balancing aggressive cost reduction with the uncompromising precision required for life-sustaining medical technology.
Core Criteria for Vetting Contract Manufacturers
- Regulatory Certification Status
Ensure the partner is ISO 13485 certified at a minimum, with experience navigating FDA 21 CFR Part 820 requirements. Their facility audit history must be impeccable. - Technical Specialization
Look for high-density interconnect (HDI) capabilities and advanced inspection systems, such as 3D Automated Optical Inspection (AOI) and X-ray imaging, essential for miniaturized CGM electronics. - Fiscal Transparency
A transparent partner provides open-book pricing, detailing material markups, labor rates, and overhead costs, preventing hidden fees that erode your expected ROI.
Comparing Manufacturing Partnership Models
| Feature | Tier 1 (High-Volume) | Specialized MedTech EMS |
|---|---|---|
| Regulatory Focus | Compliance-driven | Deep Quality Integration |
| Cost Structure | Economies of scale | Process optimization |
| Agility | Standardized | Design-for-Manufacture (DFM) |
Strategic Questions for Supplier Audits
- How do you manage component obsolescence?
The partner must have a proactive supply chain strategy that anticipates EOL notices, preventing expensive emergency redesigns. - What is your DFM process for cost reduction?
A high-performing partner should offer suggestions to simplify PCBA layout for faster assembly, directly lowering your labor cost per unit. - Can you handle cleanroom assembly requirements?
Verify if their environmental controls match the specific sterility needs of your glucose monitor components to avoid contamination-related failures.
By adopting a data-driven approach to design and manufacturing, OEMs can achieve the dual objective of driving down costs while elevating the quality of their medical devices. Strategic optimization is not just a fiscal necessity; it is a vital component of patient care and market leadership. Are you ready to optimize your production line for maximum ROI? Contact our team of medical manufacturing specialists today for a comprehensive design review.